Table of Work Items widget
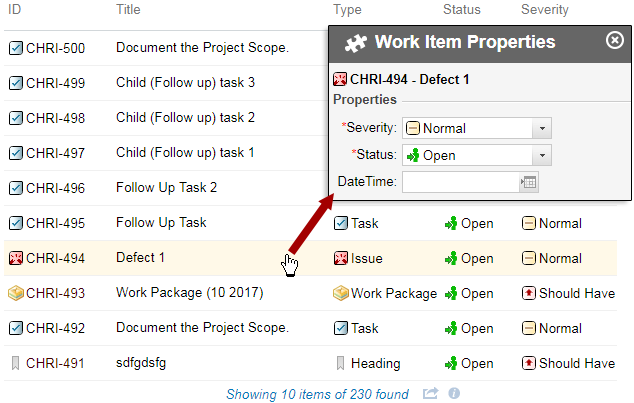
A simple but useful report element is a table of unresolved Work Items sorted by type, severity, and current status, and showing several key fields such as ID, Title, Status, and Severity.
If you have the appropriate permissions, you can modify a Work Item's fields by clicking on it.
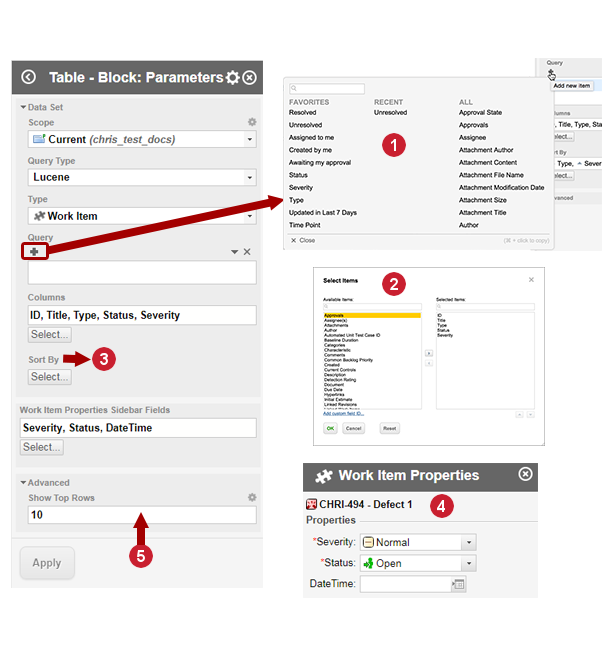
The fields that appear can be configured in the Table - Block: Parameters sidebar.
Launch the Table - Block: Parameters sidebar:
For a
 Plan: Click on

 Customize Plan Report
  above the table widget.
For
 LiveReport and Info Pages: Click on
 Edit above the table widget.
Then follow the instructions defined in Parameters sidebar.
|
|
|
|
|
 Visual query builder
 Select fields to show as columns.
 How the Work Items are sorted in the table.
 Select Work Item Properties sidebar fields.
 Number of items that appear in the table.
The Work Item Properties sidebar Fields only work for  Work Items.
See the Kanban Board section to learn how to define what fields appear and what widgets are affected.
The table will show a subset of all available project data, so it's necessary to set some parameters to retrieve the desired data.
Scope: Specify the scope of the data to be retrieved. The default is the current project, but you could retrieve data from a different project from the one in which you are currently working, or from the entire repository. In this example, the scope is the current project.
Query Type: Select the query language to retrieve data. The full arsenal of Polarion's data retrieval capabilities are available here, including Apache Lucene query language, SQL, or combinations of Lucene and Velocity, or SQL and Velocity. For the purposes of an easy example, Lucene is used, as many users are familiar with this type of query, and the Visual Query Builder is integrated in Widgets enabling users who don't know a query language to build queries visually.
Type: Specify what main artifact type is the basis for the data. You can opt for the data to be Work Items, Documents, Plans, Test Runs, or Pages. You can refine this by selecting one of the subtypes defined for the different artifact types (if any).
If the artifact type is Work Item or Document, you can select the type in the list. For example, for the Work Item artifact type, there might be Requirements, Test Cases, Issues, Tasks, and so forth. The Document artifact type might have subtypes such as Requirements Specification or Risk Analysis. The subtypes list varies according to the Scope. For example, Repository scope lists all Work Item and Document types defined in the global configuration, whereas selecting a project limits the list to the types defined for the selected project.
For this example, Work Item is selected, because the table must show Work Items.
Query: Refine data shown in the table through a query. In this simple example, Lucene is selected as the query type. For Lucene queries, the same Visual Query Builder tool you may already have used in the Work Item Tracker is available. You can use it to add multiple visual query elements to the Query to build queries ranging from ultra simple to very complex. For this simple example, only one element is added: a query on the Resolution field, for a value of "unresolved".
Columns: Specify the columns to show in the table, and their order, using the Select button under the Columns field. The selection dialog is the same one you use to customize the Work Items table in the Work Item Tracker. Columns in the table display Work Item fields, because Work Item is selected in the Type parameter.
For this example, the ID, Title, Type, Status, and Severity fields are selected to appear as table columns.
Tip:What you can select to show in Columns depends on the artifact type selected in Type. Work Items have different items than Documents or Test Runs.
Sort By: Specify how the Work Items are sorted in the table. The specification of the example called for sorting by type, severity, and current status. Sorting by Type first causes the different Work Item types to be grouped. So all Issues appear first, followed by all Change Requests, Requirements, and finally Test Cases. Within those groups, the rows are sorted by severity in ascending order. Finally, the rows for a given severity are sorted by the current status of the individual Work Items.
This field also has a Select button, which leads to the same dialog in which you can select the fields to sort on, the sort order (ascending/descending), and the order of the fields.
Work Item Properties Sidebar Fields: Select the fields that appear in the Work Item Properties Sidebar.
Show Top Rows: Expand the Advanced section of the sidebar to see this field. This can be an important parameter if the table is potentially very large. The default is 50, meaning the table only shows the first 50 items matching the query, and displays a link that opens the Work Item Tracker in a new browser tab and load all the marching Work Items.
Click the Apply button in the sidebar to update the visual rendering of the Widget in the Page Designer after modifying parameters. This applies to all Widgets.
Users do not see any changes to the Page until you save changes you make in the Page Designer. After the Page is saved, the report is live in the sense that the table reflects the status of the items in the project as of the time the user loads the report page. Users can see any later changes in the data by refreshing the page in their browser.