Dialog Window of the Event Debugger
The Event Debugger lets you accurately control the execution of simulation events, when you click Start/Stop Simulation ![]() or Single Step Simulation
or Single Step Simulation ![]() . As opposed to clicking Start/Stop Simulation, you can, for example, enter a condition when the Event Debugger is to Start/Stop the Simulation. Then, you can follow the execution of the events in the Event Debugger.
. As opposed to clicking Start/Stop Simulation, you can, for example, enter a condition when the Event Debugger is to Start/Stop the Simulation. Then, you can follow the execution of the events in the Event Debugger.
|
|
The column Breakpoint shows an S, for a breakpoint you inserted, by double-clicking a cell in the row.
Double-click a cell in the row where you would like to insert a single breakpoint. Then the Event Debugger stops the simulation immediately before the EventController processes that event. Double-click again to remove the breakpoint.
The column Type shows the type of event.
The column Time shows the point in time the event is going to be executed.
The column Receiver shows the receiving object.
The column Sender shows the sending object.
The column Insertion Time shows the point in time at which the event was inserted into the EventController.
The column Parameters shows additional information for certain event types, for example the sensor ID (SensorStart), the name of the failure profile (DisruptionBegin) or the parameters passed to a Method (MethCall).
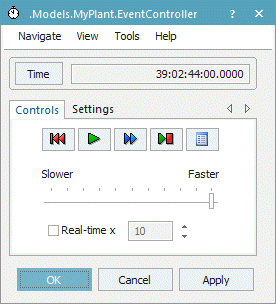
To open the list of scheduled events, click List ![]() on the tab Controls in the EventController. You can also hold down Shift and double-click the icon
on the tab Controls in the EventController. You can also hold down Shift and double-click the icon ![]() of the EventController in the Frame.
of the EventController in the Frame.
Related Topics
List of scheduled events | |

