Execute a Test Run using Polarion
The execution of Test Cases in a Test Run has been revamped in Polarion 18.
See the Classic Test Execution View section to configure Polarion to use the old Test Execution view workflow.
Classic test execution view will become obsolete:
To give current testers some time to transition to the new Test Execution View workflow, we will still support the Classic Test Execution View for a few more releases.
Get to know the improved workflow outlined in this section.
Automated tests are run by the Polarion build tool according to the build configuration, so you do not need to explicitly invoke Test Run execution. This section discusses manual execution of Test Runs in Polarion. If manual testing will be done externally to Polarion, see Executing Test Runs Offline Using Excel.
As previously mentioned, a Test Run represents an instance of executing a set of test cases, which have been defined in Work Items of the Test Case type. At some point after a Test Run is created, a tester manually performs the testing steps defined in the Test Cases of the Test Run. During the actual execution, the result of each testing step is recorded, as is the outcome or "verdict" of each Test Case (passed, failed, or blocked).
Even if you use some external tool to execute Test Cases, testers can still execute a Test Run to log the results of external testing so that testing history and traceability are maintained in Polarion across the full life cycle.
It is possible that another user could modify the Test Case or Test Steps while you have paused test execution. If this happens, the Resume Test Case dialog box (if Test Case was revised) appears or the Retest Test Case dialog box (if Test Steps were revised) appears.
Resume Test Case warns you that you are no longer testing what was planned. For example, the Test Case was planned from HEAD revision, and the Test Case subsequently was updated while the Test Case was in progress. Or, possibly the revision in which the Test Case was planned changed (for example, frozen to a different revision in a Test Run where Test Cases are selected via the LiveDoc on Execute option). In both scenarios, after clicking Resume Test Case in the dialog box, the Test Steps remain the same and you continue working in the revision in which you started.
Retest Test Case means that the Test Case (including the Test Steps) has been updated and retesting needs to be done in the new version. If you click Retest Test Case, the Test Case is reloaded and execution is automatically started.
Execute a manual Test Run
Open the Test Run's page by clicking
 Test Runs in Navigation, and selecting the Test Run in the table of Test Runs. You can use the visual query builder on the Test Runs page to filter a large number of Test Runs. For example, you might query for only Manual type tests, based on a specific Test Run Template.
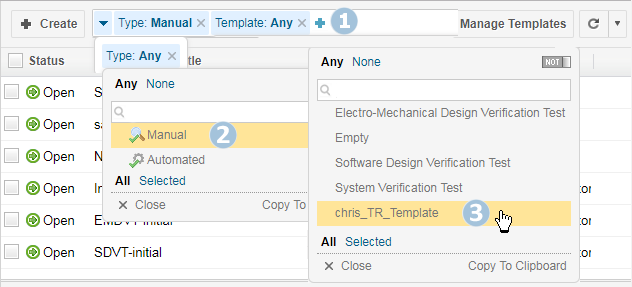
The Test Run's details appear below the list.
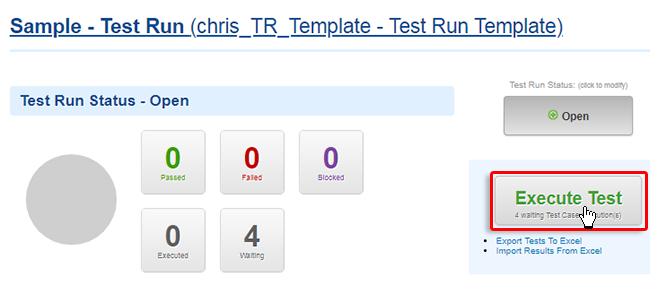
Click the green Execute Test button.
A table listing the Test Cases currently associated with the Test Run appears.
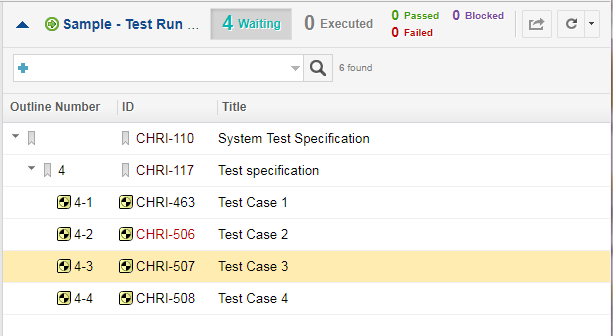
The Outline Number column appears if the document referred to by the Test Run has Outline Numbering turned on.
Buttons:
 Refreshes the table and/or Test Case. The top refreshes both.
When a Test Case is modified (executed/restarted/or paused), the columns and the Test Run statuses ("Waiting", "Executed" etc.) are refreshed automatically.
Next Skips items that can't be executed and jumps directly to the next executable Test Case.
 Cycle through all items, including those that can't be executed, such as Headers.
 Launches a table of your queried results where you can add or remove Test Cases, if the Test Run type allows it.
 Define Auto Advance and Auto Start the next Test Case
  Execution Settings.
(Optional) Click
 , and then
  Tile Panes Vertically to display the table and selected Test Case side by side.
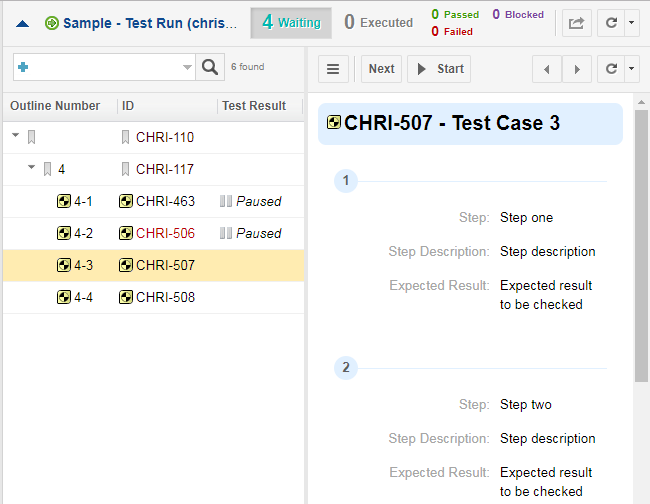 (Or
(Or Tile Panes Horizontally to return to the default, table over the Test Case, view.)
 Use the query builder above the table to search for individual Test Cases or sort by things like Severity.
You cannot set a default query, but you can easily save them for quick reuse.
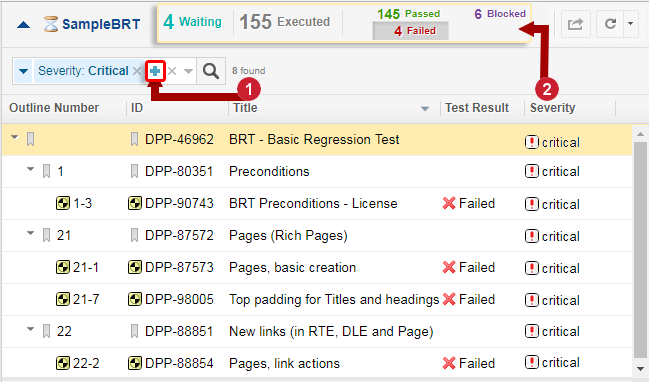
 Launch query bubble for advanced filtering options.
 Filter by result or status.
You can also quickly narrow down what Test Cases appear by clicking on a Status or Test Case result.
Click on a selected status or result a second time to remove the filter.
If a Test Run item is selected in the table that cannot be executed (
 Headings, other
  Work Items or
  Test Cases) an informational message appears below the table.
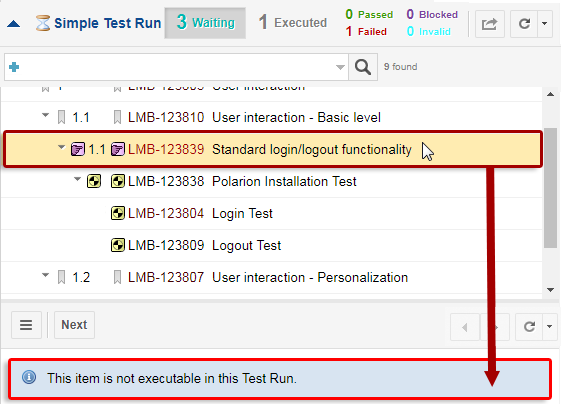
The table also supports iterations.
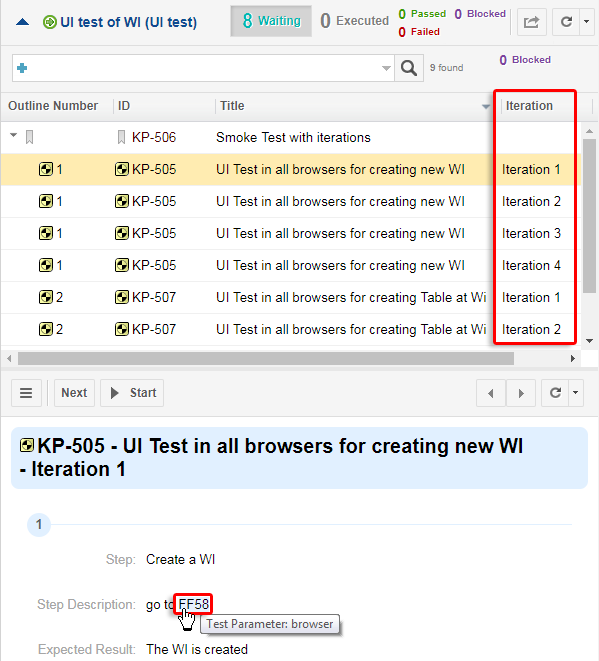
Iterations are shown as multiple rows in the tree view.
Only iterations matching the query/filter are shown.
Child items are shown under the last displayed iteration of the parent. (If the parent has them.)
If no iteration of a parent matches the current query/filter but some children do, the parent is shown as a row representing the Test Case. But, the parent is not bound to any iteration or Test Record. It does not show any status and so forth.
Note:Adding iterations directly into the execution view is not possible. They can only be added prior to execution using the
 Select Test Cases command.
Right-click on a column to customize what columns are
 visible or hidden.
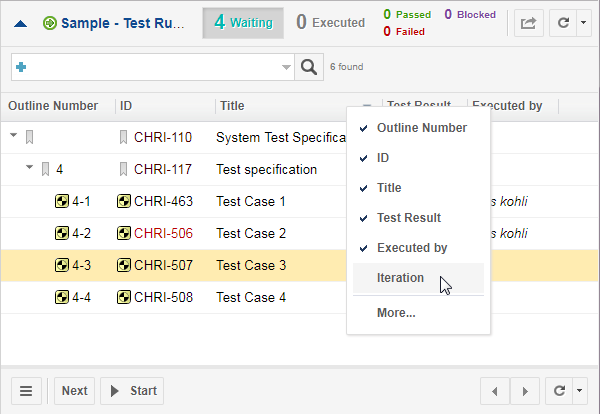 Note:
Note:Set Polarion to remember your table settings:
If you add or remove columns by right clicking and adding or removing a
or sort columns by clicking on them, your settings will be lost if the browser is refreshed.For a persistent setup, click More, make your changes in the Customize Table dialog box, and then click Apply.
Click More in the column context menu to launch the Customize Table dialog box. There you can completely customize what columns are visible, how they are ordered and sorted, and even whether or not to display icons in the columns that support them.
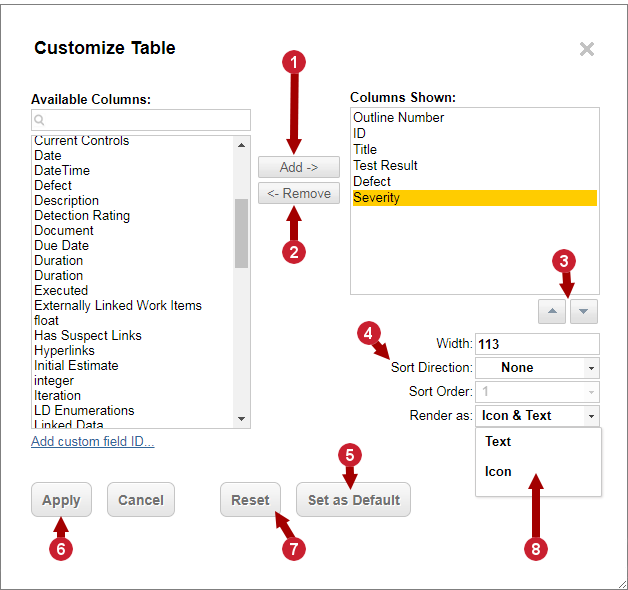 Add an Available Columns item that you want to appear in the table.
  Set as the default for all Test Run tables in the current Project.
 (Requires Administrator rights.)
Remove an Item that is currently visible in the table. Applied changes will only be saved for the current user.
 Set the column order.
(Top appears first on the left.)
 Reset to the Project default.
 Customize how column data is sorted.
 What to display in columns that support icons and text.
When you add a custom field ID, use the following syntax: testCase.fieldID.
Just the fieldID is fine for the Work Item table but not the Test Run table.
When configuring sorting, the Test Record fields must precede any Test Case fields in significance.
The Execute Test button widget supports a Sort Test Cases by parameter (for Test Runs that are not defined by a LiveDoc), but it has no effect when using execution view. (It is used in the Classic Test Execution View.) Instead administrators should define their desired default configuration here in the Customize Table dialog box. (The default sorting configuration is ascending by Test Case ID.)
Administrators can also set repository wide Test Record table settings by editing the testrecord-table-settings.xml in the repository.
(repo/.polarion/testing/configuration/testrecord-table-settings.xml)
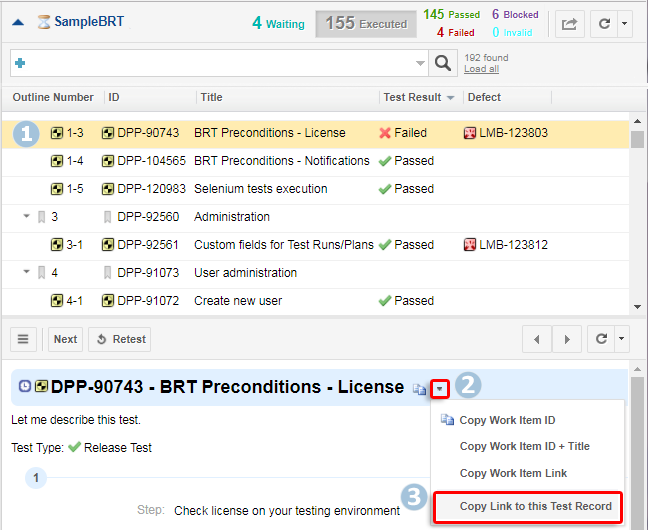
(Optional) Send a custom link to what you are testing to another user.
Click on a Test Case in the table.
Hover over the Test Case's title below the table and click
 when it appears.
Click Copy Link to this Test Record.
The browser link is copied to your clipboard.
URL parameters also support iterations. For example, in record=projectID/testCaseId$2, the $2 is the iteration number.
The link can also be opened in a
 Project Baseline.
Or, combined with a Test Run revision to show the corresponding Test Record for a Test Case retested at a later date.
The target Test Record appears highlighted in the table, even when the filter settings are set to hide it.
If the target Test Record cannot be found in the Test Run, a warning message appears.
The record's parameter remains in the URL until the selection is changed by the user.
Click on the selected Test Case or Heading's title when it appears below the table to open it in a new browser tab.
Click Next to jump to the next available Test Case in the table.
Click
 Start to execute the selected Test Case.
If the selected Test Case was already started but
 Paused, Start will be replaced with Resume.
If the Test Case has been run but needs to be run again, a
Retest button appears.If the button is disabled, hover over it for a tooltip that explains why it is.
The Test Case's Test Steps appear below and the timer begins or resumes.
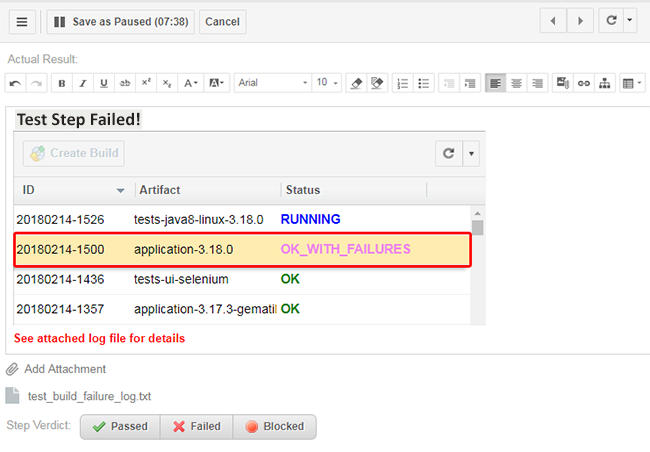
Click
Save as Paused to pause and save Test Step without a verdict.You can enter and format rich text using the Document Editor toolbar and even add
 images directly into the result field of the test step.
Click
 Add Attachment to attach a reference file.
Hover over an already attached file and click
 to remove it.
Caution:Limited rich text editing for offline test execution:
Offline test execution does not support the following rich text editor features:
Images inside the text. (Like the example above.)
Hyperlinks within the text.
Tables within cells.
Bullet lists.
These limitations also apply to the Excel Round-trip feature.
Click on a Test Step Verdict (
 Passed,
 Failed or
  Blocked) and continue on to the next test step.
(Optional) Click Recent to select from a list of previously entered Test Step or Test Case verdict comments.
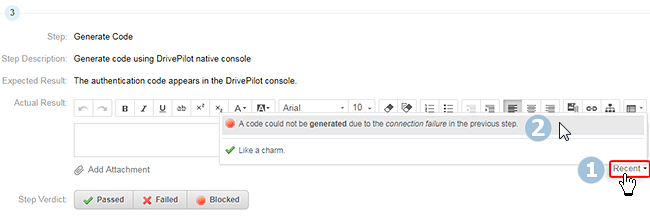
The Recent menu displays comments from any Test Run (by any user), that contains the selected Test Step or Verdict.
Comments from a previous iteration in the same Test Run are also included.
Note:The selectable comments support rich text formatting and offer an image preview, but only insert a text placeholder for the images.
Below the final step you'll see a timer that displays the total Duration of the entire Test Case.
Duration is the time it took to complete all Test Steps.
A timer is also visible at the top of the Test Case, just below the table.
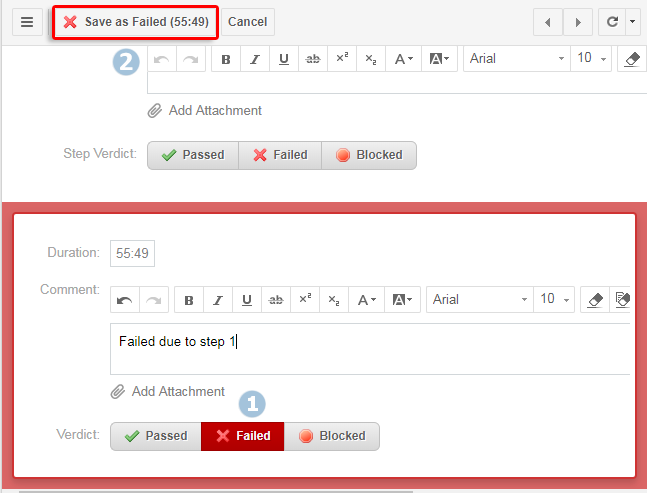
Click on a verdict button and click Save as [Result].
The [Result] changes according to the verdict you selected.
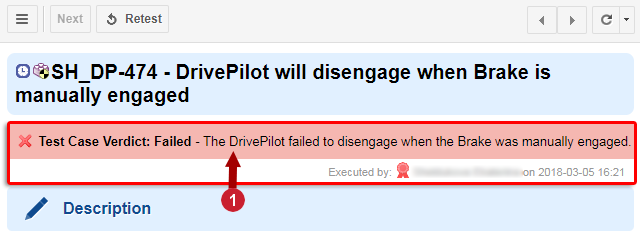
If the project was created using any of the following templates, then a customizable verdict banner appears below the Test Cases title:
(Templates: Agile, E-Library, V-Model, Drive Pilot, V-Model QA, Drive Pilot QA.)
(
Taken from the comment entered in the verdict.)Tip:Administrators can also configure what appears in the section above the Test Steps.
See
 Administration
 TestingTest Execution Form for details.
With the default configuration, any Test Case
Saved as Failed will automatically create a Defect Work Item.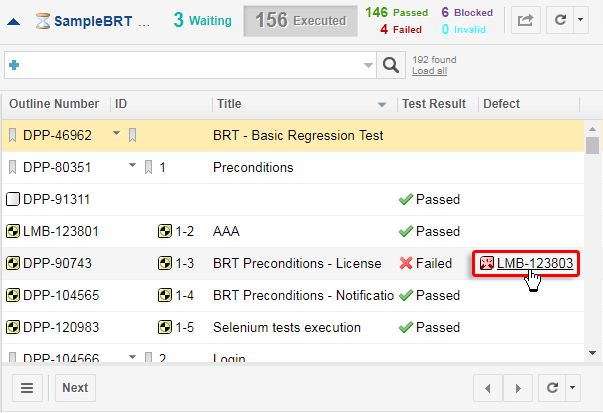
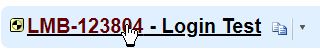
Click on the defect in the table to launch it in a new browser window.
You can manually proceed to the next Test Case by clicking Next under the test execution table.
Note:Test execution and Project Baselines:
You can view Test Runs executed in a previous
Project Baseline, but you cannot execute them.However, the Waiting button can be used to see the last Test Cases that were waiting at that point in the history and open the Test Run's execution view.
(Only for LiveReport based Test Runs created with the execution view implemented in Polarion 18.)
Note:Empty Test Step values:
Empty Test Step values are omitted to save space and increase readability.