Chart (object)
![]()
The Chart graphically displays the data sets that Plant Simulation recorded during a simulation run. Define data to be plotted by:
Using a table containing the data, such as simulation results.
Defining input channels that record values of attributes of interest of the objects.
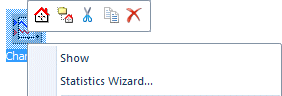
A Chart object, which you insert into a Frame, provides the Statistics Wizard. Select the command Statistics Wizard on the context menu of the Frame to open it. Select the class(es) of object(s) for which you would like to show statistics values in the Chart under Class. The Chart only adds material flow objects to the display for which you selected the check box Resource statistics on the Tab Statistics.
|
|
|
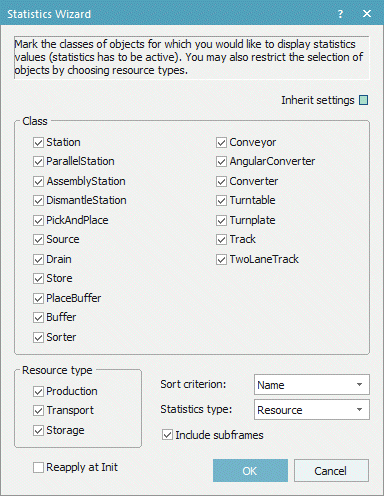

To inherit the settings you select below, select Inherit Settings 
To show statistics values of the Station, select this. The Chart only adds material flow objects to the display for which you selected the check box Resource statistics on the Tab Statistics. You can select any number of classes.
To show statistics values of the ParallelStation, select this. The Chart only adds material flow objects to the display for which you selected the check box Resource statistics on the Tab Statistics. You can select any number of classes.
To show statistics values of the AssemblyStation, select this. The Chart only adds material flow objects to the display for which you selected the check box Resource statistics on the Tab Statistics. You can select any number of classes.
To show statistics values of the DismantleStation, select this. The Chart only adds material flow objects to the display for which you selected the check box Resource statistics on the Tab Statistics. You can select any number of classes.
To show statistics values of the Source, select this. The Chart only adds material flow objects to the display for which you selected the check box Resource statistics on the Tab Statistics. You can select any number of classes.
To show statistics values of the Drain, select this. The Chart only adds material flow objects to the display for which you selected the check box Resource statistics on the Tab Statistics. You can select any number of classes.
To show statistics values of the Store, select this. The Chart only adds material flow objects to the display for which you selected the check box Resource statistics on the Tab Statistics. You can select any number of classes.
To show statistics values of the PlaceBuffer, select this. The Chart only adds material flow objects to the display for which you selected the check box Resource statistics on the Tab Statistics. You can select any number of classes.
To show statistics values of the Buffer, select this. The Chart only adds material flow objects to the display for which you selected the check box Resource statistics on the Tab Statistics. You can select any number of classes.
To show statistics values of the Sorter, select this. The Chart only adds material flow objects to the display for which you selected the check box Resource statistics on the Tab Statistics. You can select any number of classes.
To show statistics values of the Conveyor, select this. The Chart only adds material flow objects to the display for which you selected the check box Resource statistics on the Tab Statistics. You can select any number of classes.
To show statistics values of the Turntable, select this. The Chart only adds material flow objects to the display for which you selected the check box Resource statistics on the Tab Statistics. You can select any number of classes.
To show statistics values of the AngularConverter, select this. The Chart only adds material flow objects to the display for which you selected the check box Resource statistics on the Tab Statistics. You can select any number of classes.
To show statistics values of the Converter, select this. The Chart only adds material flow objects to the display for which you selected the check box Resource statistics on the Tab Statistics. You can select any number of classes.
To show statistics values of the Turnplate, select this. The Chart only adds material flow objects to the display for which you selected the check box Resource statistics on the Tab Statistics. You can select any number of classes.
To show statistics values of the Track, select this. The Chart only adds material flow objects to the display for which you selected the check box Resource statistics on the Tab Statistics. You can select any number of classes.
To show statistics values of the TwoLaneTrack, select this. The Chart only adds material flow objects to the display for which you selected the check box Resource statistics on the Tab Statistics. You can select any number of classes.
Select the type of resource(s) for which you would like to show statistical data of the selected object(s) in the Chart under Resource type. Select the Resource type on the tab Statistics of an object collecting statistical data. With the check boxes in the Statistics Wizard you can restrict, which objects the program shows. Production is the default for Source, Drain, Station, ParallelStation, AssemblyStation, and DismantleStation.
Select the type of resource(s) for which you would like to show statistical data of the selected object(s) in the Chart. Select the Resource type on the tab Statistics of an object collecting statistical data. With the check boxes in the Statistics Wizard you can restrict, which objects the program shows. Transport is the default for the PlaceBuffer, Buffer, Sorter, Track, TwoLaneTrack, Conveyor, AngularConverter, Turntable, Transporter, and Container.
Select the type of resource(s) for which you would like to show statistical data of the selected object(s) in the Chart. Select the Resource type on the tab Statistics of an object collecting statistical data. With the check boxes in the Statistics Wizard you can restrict, which objects the program shows. Storage is the default for the Store.
Select the criteria according to which the program sorts statistical data from the drop-down list Sort criterion:
To sort the stations by their name in alphabetical order from A to Z, select Sort criterion > Name. To sort the stations in the order that meets your needs, drag the stations onto the Chart in the order it is to show them. To change the order at a later point in time, edit the table of the Input channels by cutting the respective columns of the objects and pasting them in the desired order.
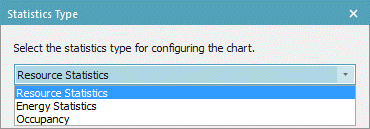
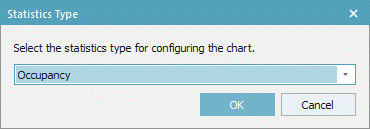
Select the statistics type: Resource Statistics, Energy Statistics, or Occupancy.
To also show statistical data of objects contained in Frames contained in the Frame in which the Chart is located, select Include subframes
 .
.To reapply the settings while the simulation model is initialized, select Reapply at Init
 .
.Click OK to display the Chart window with the settings you selected.
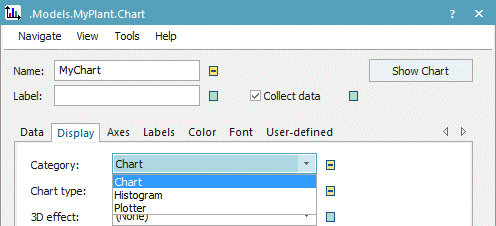
When you drag a material flow object onto a Chart, which you have not configured yet, you have to select the statistics type. By default you can select Resource or Occupancy. When you activate energy features, you can also select Energy. The different statistics types provide different value sets. The meaning of the different states is described in the Statistics Report under Resource Statistics of Stationary Resources and Energy Statistics - Energy Statistics.
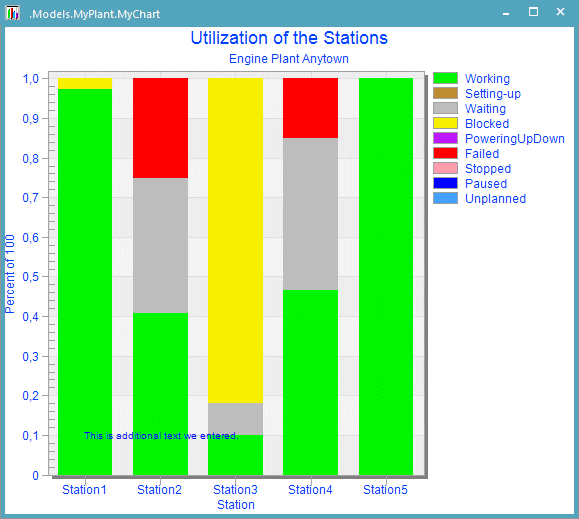
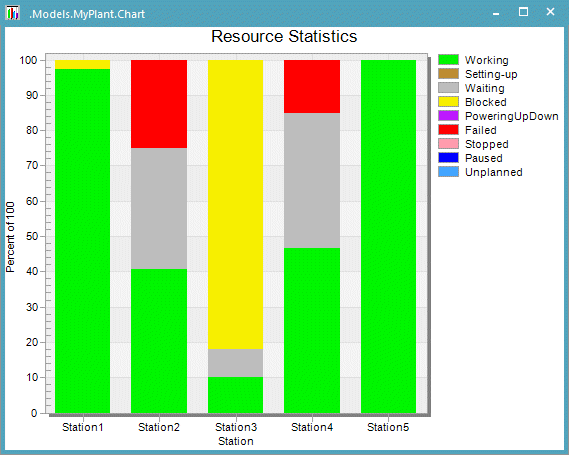
For the statistics type > Resource, the Chart shows the Name of the object and the states it is in: Working, Setting-Up, Waiting, Blocked, Powering up/down, Failed, Stopped, Paused, or Unplanned.
For the statistics type > Energy, the Chart shows the energy states of the object: Working, setting-up, operational, failed, standby, and off.
Note:The energy states of the material flow objects differ from the resource states with the same name. The values for the resource states refer to the statistics collection period, while the values for the energy states refer to the total energy consumption.
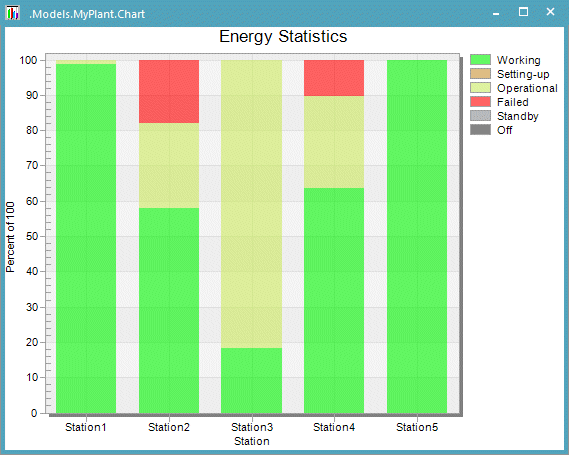
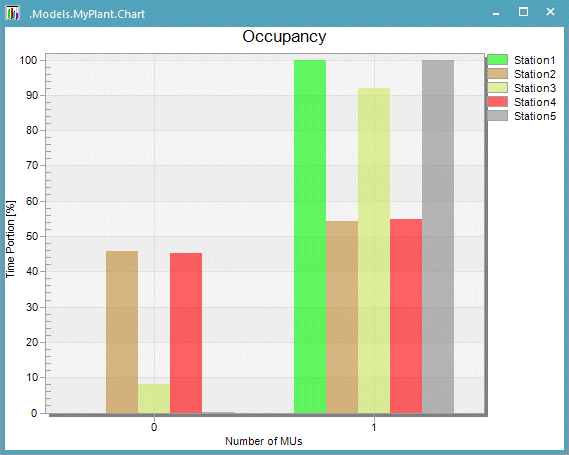
For the statistics type > Occupancy, the Chart shows the Name of the object and the number of parts located on it.
You can also show the diagram picture of a Chart in an HtmlReport, compare Display a Chart.
Drag-and-Drop for Chart Objects
Employ drag-and-drop to accomplish these tasks:
To do this | Drag | To | Accelerator |
|---|---|---|---|
Show the statistics of a single material flow object | material flow object | Chart | * |
Show the statistics of multiple material flow objects | material flow objects | Chart | * |
Show Driving statistics of the Transporter | Transporter | Chart | * |
Show Services statistics of the Worker/Exporter | Worker/Exporter | Chart | * |
Show Exporter statistics of the Worker/Exporter | Worker/Exporter | Chart | Shift |
Show the frequency distribution of the number of MUs | PlaceBuffer, Buffer or Store | Chart | * |
Show statistics of all Resources which are assigned to the LockoutZone | LockoutZone | Chart | * |
Show the contents of a table | DataTable, TimeSequence | Chart | — |
Show the value of the Variable you inserted into a Frame | Variable | Chart | * |
Show the statistics of a Frame, which has the user-defined attribute StatisticsObject | User-defined object (Frame) | Chart | * |
Show the statistics of the object Workplace within a Frame, which has the user-defined attribute AOLType | User-defined object (Frame) | Chart | * |
*When you hold down the Shift key while dropping the object onto the Chart, Plant Simulation does not add the dropped object to the Input Channels, but deletes the existing entries from the input channels.
The method addObject accomplishes the same as using drag-and-drop actions described above.
To delete one of the displayed objects, click Data Table next to Data source and delete the object from the data table.
To delete the entire contents of the input channels table, hold down Shift while you drag-and-drop a new object onto the Chart.
When you want your own object, which you modeled in a Frame, to behave like one of the built-in Plant Simulation objects when you drag-and-drop it, create a user-defined attribute of data type object for this Frame and name it StatisticsObject. This attribute may designate any of the material flow objects. The Chart then acts as if the object to which the user-defined attribute refers was dropped onto the Chart. This way you can show the statistics of a Frame according to your needs.
When your Frame contains a number of objects whose statistics you would like to show, then assign the data type table to the user-defined attribute statisticsObject. The first column of the table has to be of data type string. The Chart now acts if all objects contained in the first column of the table were dropped onto the Chart. You can also use a user-defined row index and type in the labels of the input channels.
To add the Chart to your simulation model, click ![]() Manage Class Library > Basic Objects > UserInterface > Chart on the Home ribbon tab.
Manage Class Library > Basic Objects > UserInterface > Chart on the Home ribbon tab.
Compare the sample models: Click the Window ribbon tab, click Start Page > Getting Started > Example Models and click Small Examples. Then, select the respective Category, the Topic, and the Example in the dialog Examples Collection and click Open Model.
Related Topics