Run an Analysis of Variance (ANOVA)
The application object ANOVA (ANalysis Of VAriance) ![]() performs a one way analysis of variance.
performs a one way analysis of variance.
Given are k groups of data. We want to investigate the hypothesis whether the k mean values,...,  are equal. The j-th group contains
  items
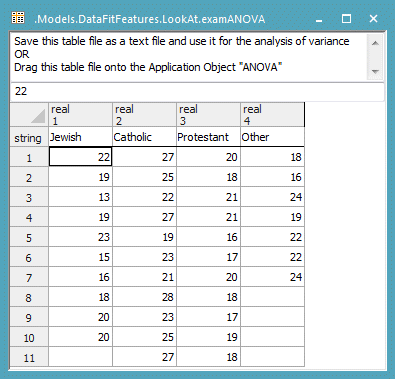
items  ,...,. The j-th group must be contained in the j-th row of the table DataX. To insert the data, drag the table onto the object ANOVA and drop it there.

Input data
Our sample young men of different religious denominations are examined. The measured value is the age, at which a man leaves home. We are interested in the hypothesis that this age depends on the religious denomination, contained in: R.D. Mason, D.A. Lind, W.G. Marchal: Statistics An Introduction, 1988, p.355 ff. Harcourt Brace Jovanovich, Publishers
Let  . The grand mean (of all values) is µ. The total sum of mean squares is
  .
.
This sum is partitioned into two addend TSS = SST + SSE, where  is the sum of squares between the mean values of the groups (sum of squares of treatments; traditionally, a group develops by distinct treatments of individuals of a whole population) and
  is the sum of squares in a group (error sum of squares). SSE measures the variability within the groups. SST measures the variability between the groups.

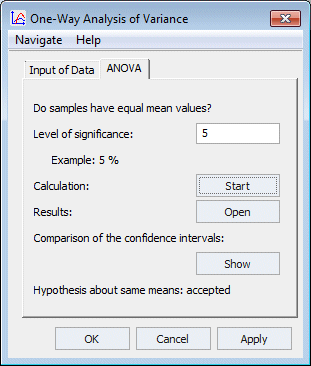
Dialog of the object ANOVA
The test determines at the given level of significance whether the hypothesis  =
=  =...=
=...=  holds true. The test executes these steps:
It determines the test statistic: F statistic 
It computes the critical value F value using the level of significance.
It accepts the hypothesis if F statistic F value.
— | Degree of freedom | Sum of squares | Mean squares |
between groups | k-1 | SST |
|
within groups | n-k | SSE |  |
total | n-1 | TSS |
Explanation of the results table of ANOVA

The data table containing the results for the test data
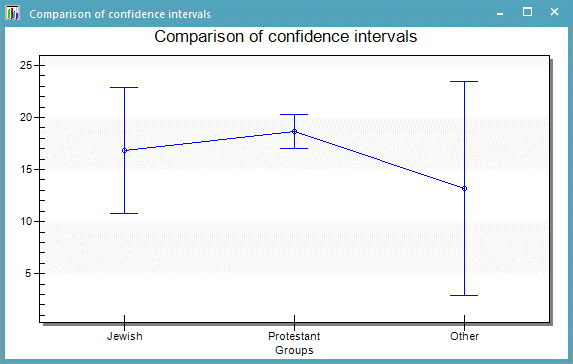
You can compare the confidence intervals with the same level of significance of all groups in a diagram. An assumption about the decision of the test can be found. In the following diagram the red bars on top show the confidence intervals of the four groups. Since the intersection of these confidence intervals is empty, the hypothesis that the mean values are equal will certainly be rejected.

Comparison of the confidence intervals of the groups
The hypothesis is rejected. With a probability of 95 percent we must thus assume that a connection between the age, at which a man leaves home, and the religious denomination exists. Click Open to open the input data table . Delete the group of the catholic men. Now the hypothesis that the mean values are equal, is accepted with a probability of 95 percent (confidence level = 5 percent).
